
how to debug lightning web component
February 2, 2023
Enable Debug Mode in Salesforce:
Step 1 : Go to Setup -> Type debug in quickfind -> click on Debug Mode
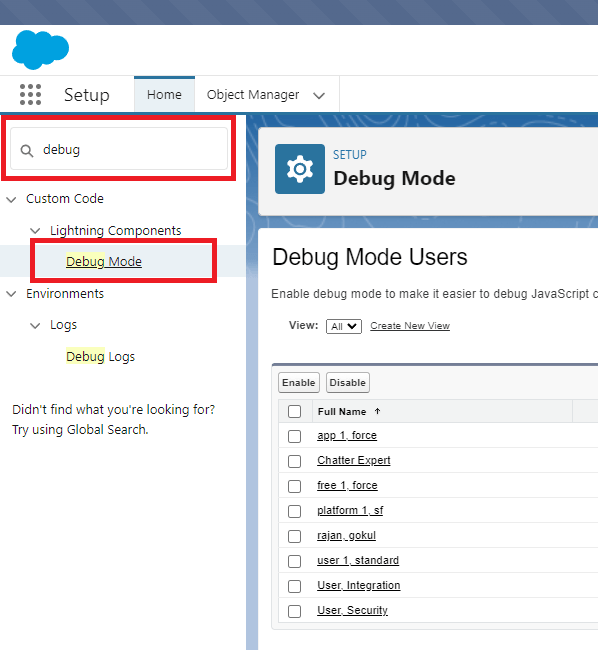
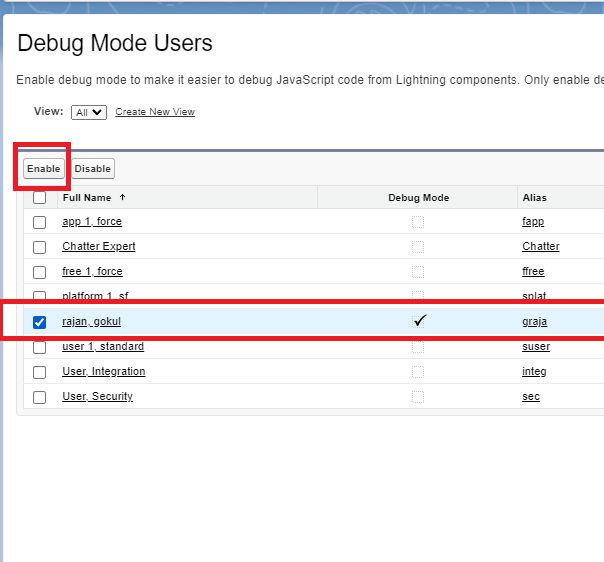
Step 2 : Select the user and click enable
If Debug Mode is enabled for user you will be seeting a message right at the top.
You Have Lightning Components Debug Mode Enabled. Salesforce is slower in debug mode. Ask your admin how to disable it
Step 3 : Open the Page where your LWC component is present
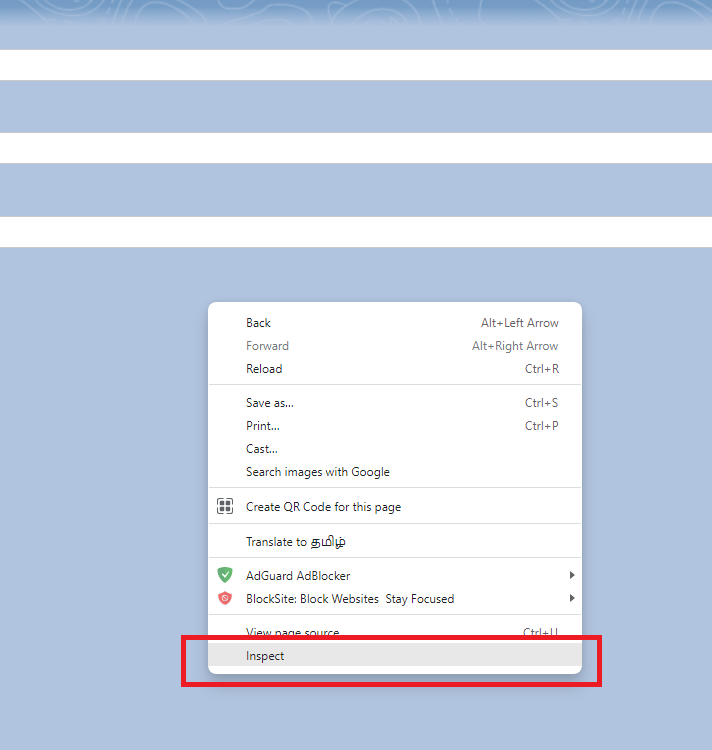
Step 4 : Right click anywhere on the page , Select Inspect
To Locate your component
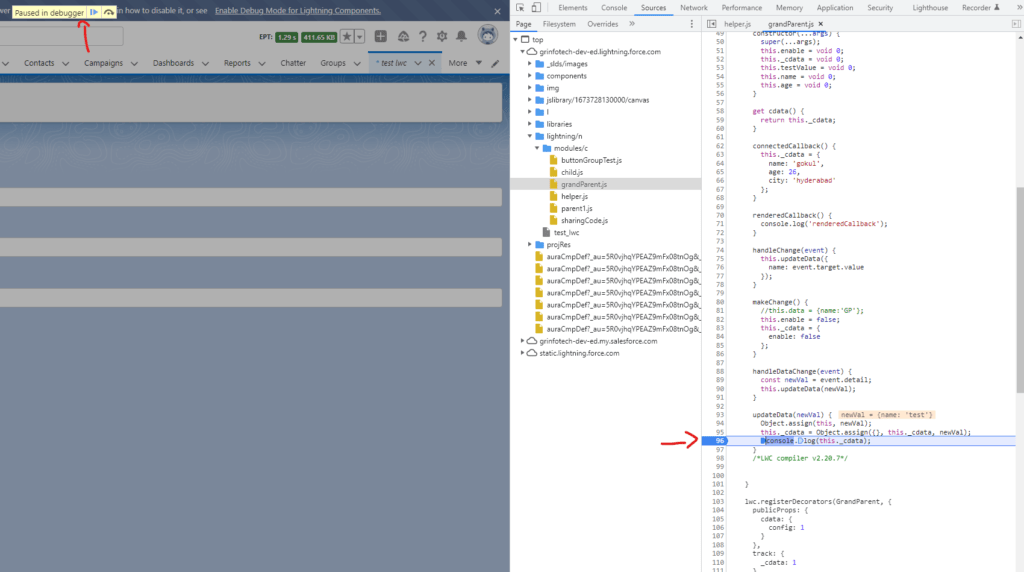
Step 5 : Go to Source Tab -> Look for your component under Top->your org domain name -> lightning/n -> modules/c -> componentName.js
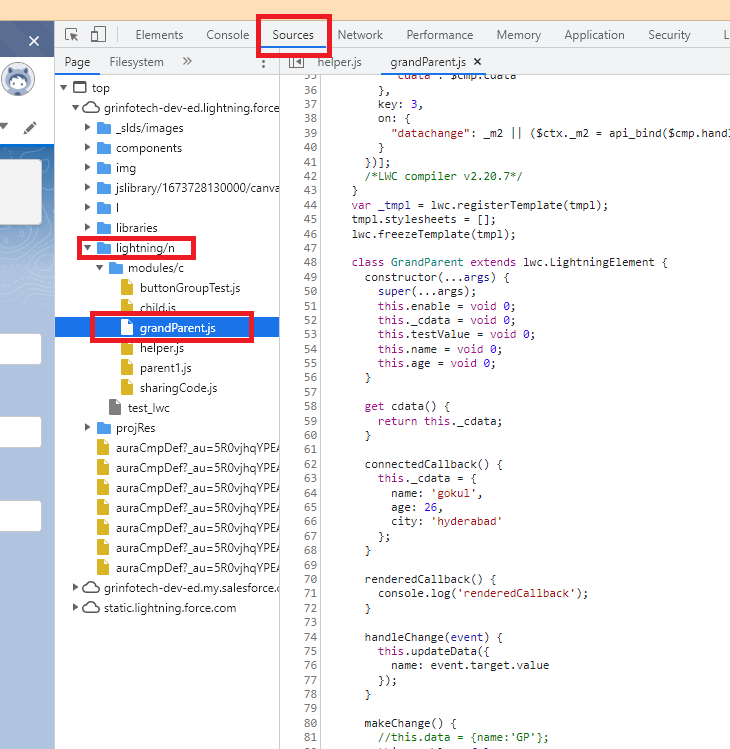
If you Unable to find the component inside modules/c then Probably Lightning Web Security is enabled
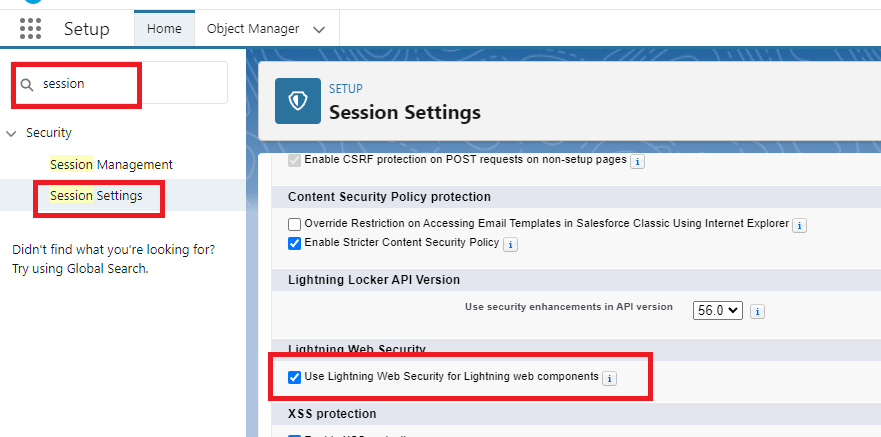
How to Disable Lightning Web Security?
Beginning in Winter ’23, new orgs have Lightning Web Security for Lightning web components enabled by default.
Steps :
Go to Setup -> Session Setting -> Lightning Web Security -> Use Lightning Web Security for Lightning web components ( uncheck it )
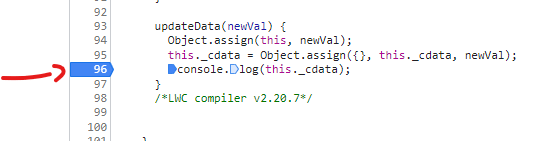
Step 6 :Now Place a debugger by clicking on the line where you want to look for values in a varaible
Step 7 : Run the Component to Start execution and code execution will stop on the line where we kept the debugger and we can inspect it.
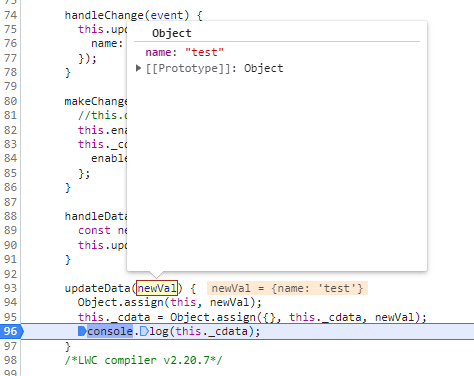
Step 8 : Hover over the variable to get the their values.
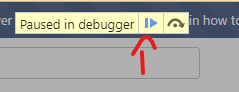
Step 9 : To continue the execution click on Resume Script Execution Button on top , or press F8
Do you want to know how to see the values from proxy Object ?
check it here LWC : See the real values contained in proxy objects