how to debug apex using visual studio code
January 22, 2023
Do you want to Know about the execution of Apex code and state of variable without writing System.debug() in every line? If yes then lets learn to debug apex using visual studio code
Commands to Run before starting to debug :
Step 1: Delete All the debug Logs:
check Out this link know more about this command Delete All Debug Logs in Salesforce Org.
npm run deleteLogsrun the above command in terminal inside your sfdx project.
Step 2 : Open Command Palette using Control+Shift+P or View->Command Palette
>SFDX: Turn On Apex Debug Log for Replay Debugger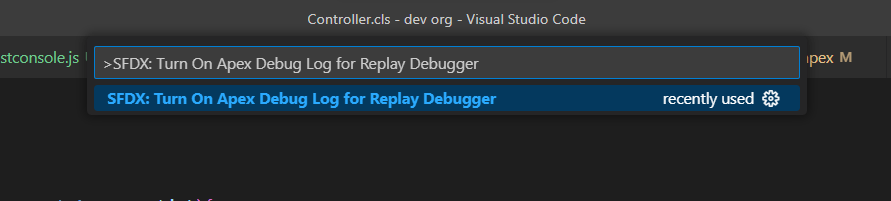
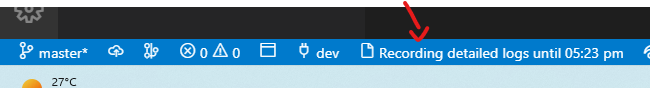
If its Successfull , you will get a notification at the bottom like this
Step 3 : Run your code
Either by running test classes , creating/updating record , Execute anonymous.
Step 4 : Get Debug logs , open Command Palette and type
> SFDX: Get Apex Debug Logs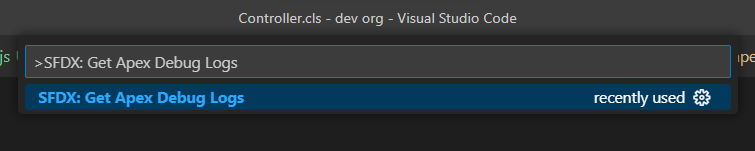
Step 5 : Select the latest logs based on your scenario
a)if you ran a futue method , choose file name with futurehandler
b) if you made some changes on ui , choose file name with aura
c) if you called an api , choose file name with api
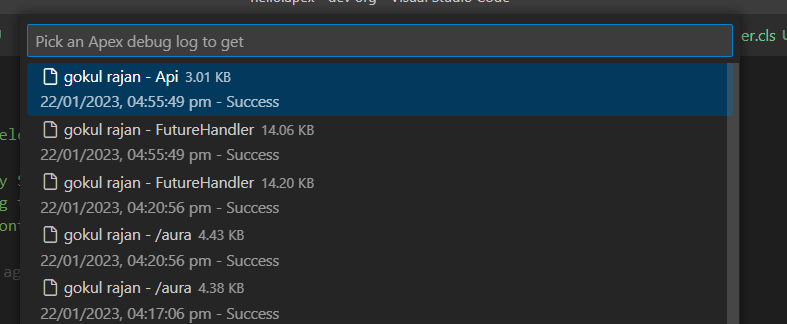
After clicking on the log file , it will download and open in new tab
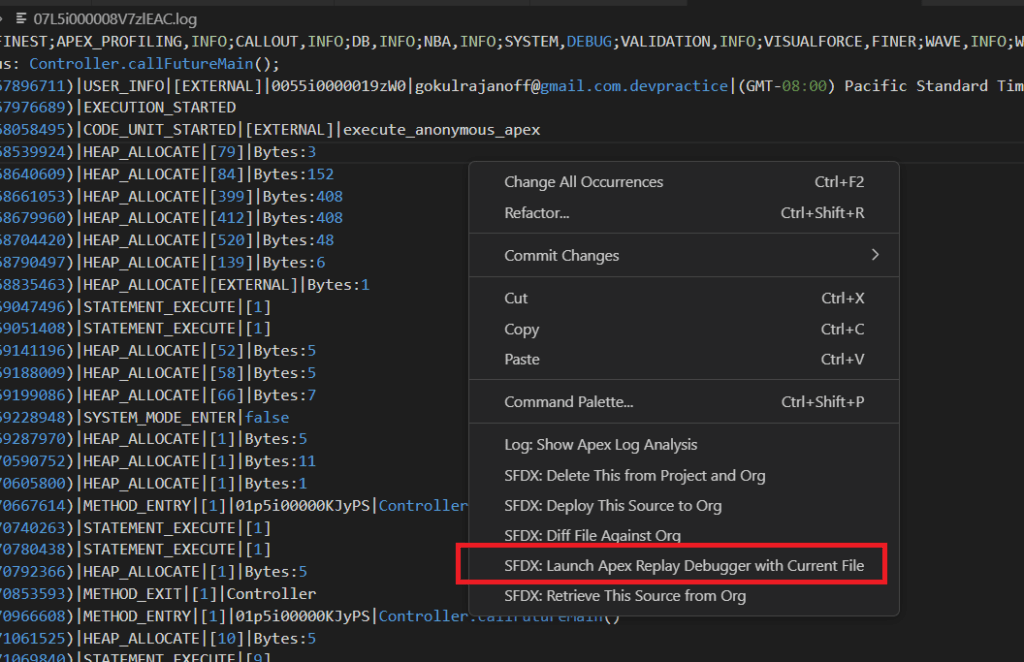
Step 6 : Now right click inside the log file and choose Launch Apex replay Debugger with current file
Lets debug apex in visual studio
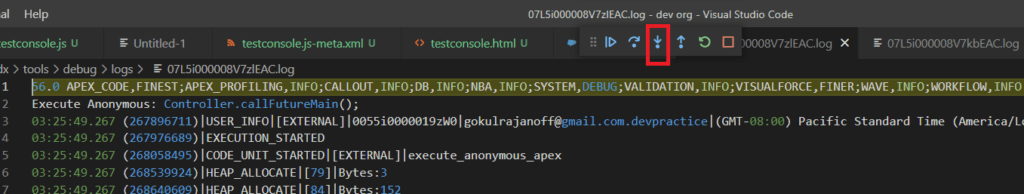
Step 7 : Click on the Step Into button until you reach the desired method in your code base
BreakPoint:
Click on the line Number to stop code execution
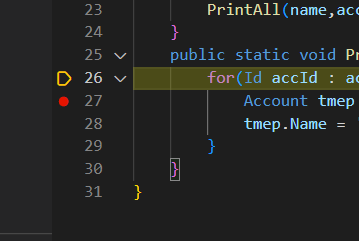
Inspect the left Side bar Variable Panel to know about the value of your variable when the code is halted by breakpoint.
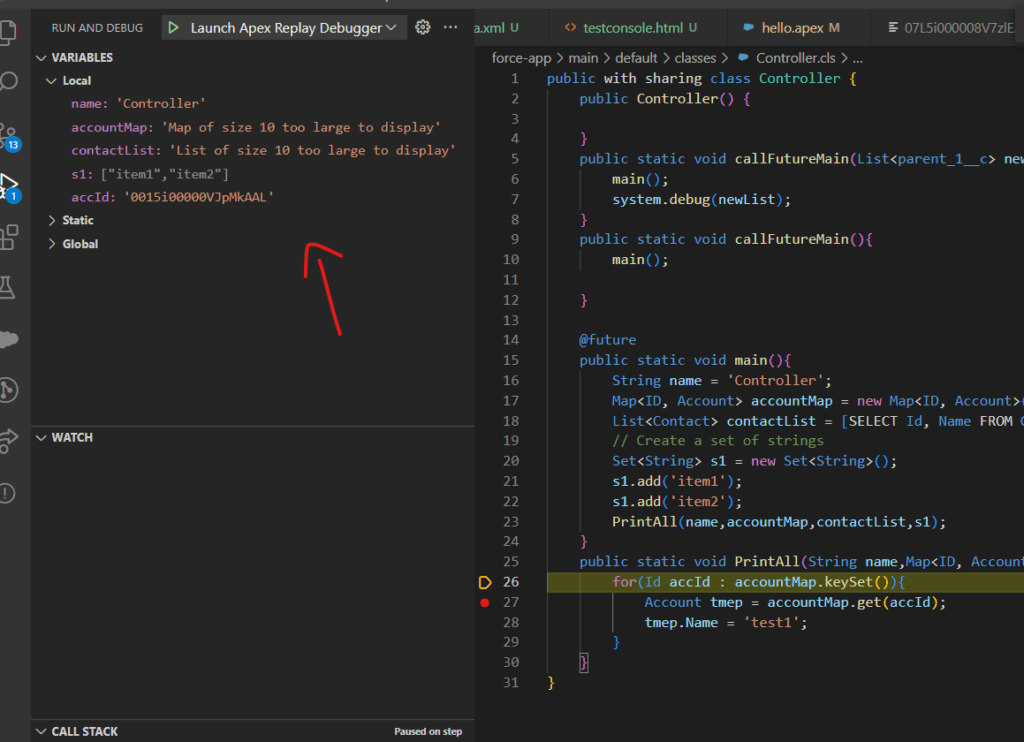
CheckPoint:
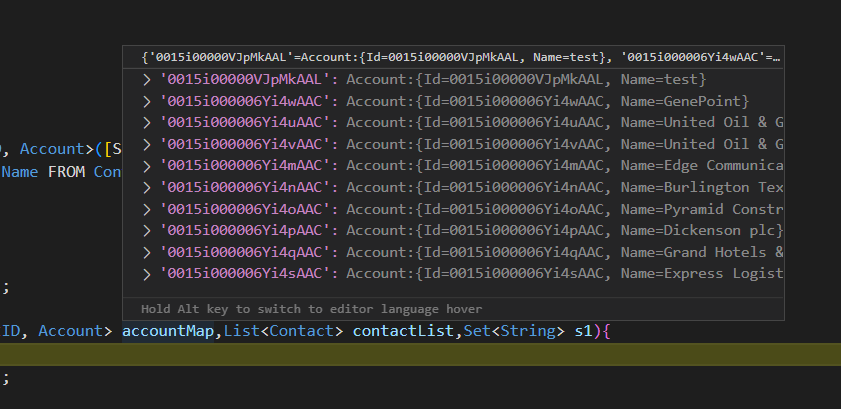
If you want to know the full values of variable , but its showing as ‘Map of size 10 too large to display’
Then head over the line where you want to know the state of the varible and Open command Palette and type
> SFDX: Toggle Checkpoint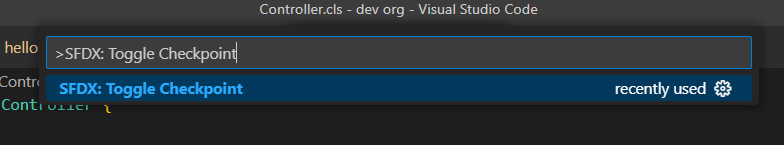
You can have a maximum of upto 5 checkpoint , no limit on breakpoints.
Then upload the checkpoint into salesforce by using running
>SFDX: Update Checkpoints in Org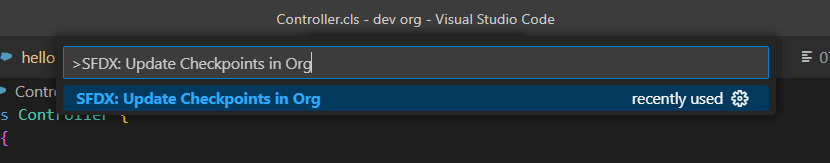
Difference between checkpoint and breakpoint :
Checkpoint -> where heap dumps are collected as your Apex code executes.
Breakpoint -> just stop the code execution
After updating the Checkpoint repeat the process from step 3 :
You will get the full values of the varaible when you have placed checkpoint like this.
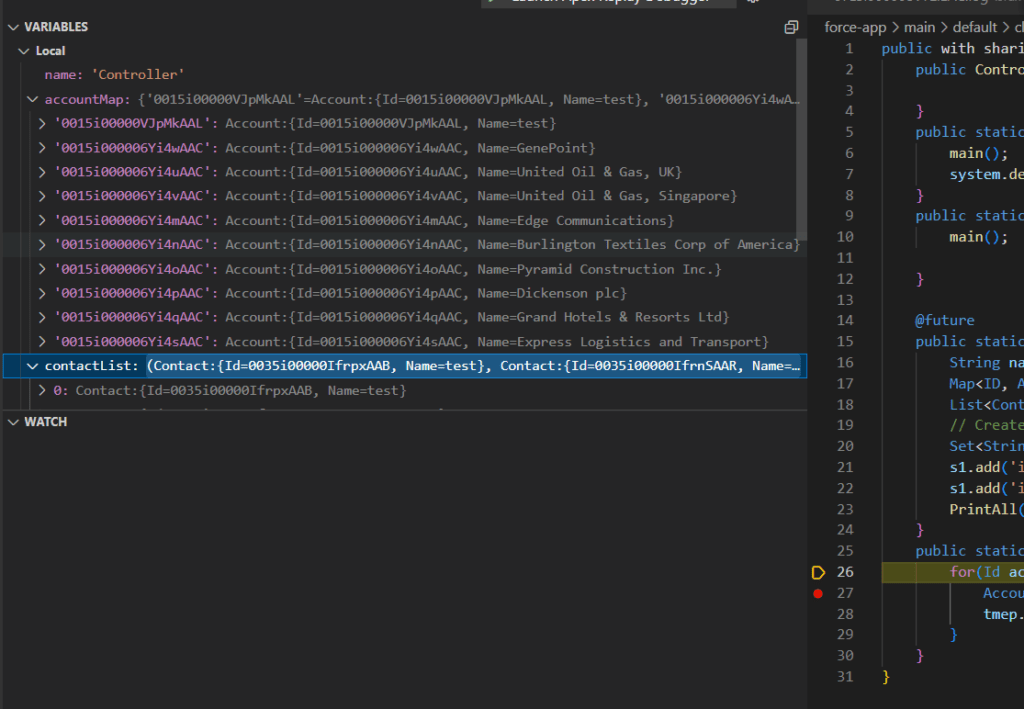
Values will appear on hover as well